Scientific Python 4: Simple Interactive Scientific Program With matplotlib
17 May 2019Sometimes scientific research has to do with a large number of repetitive experiments. In certain cases, the researcher has to adjust some key parameters of his/her application frequently. It may be inefficient to modify the code directly to do so, but it is also too demanding to write a special GUI for this scenario. Fortunately, matplotlib provides us with a concession, for it is able to generate simple interactive GUI with little effort. you can refer to the documentation of matplotlib.widgets if you want to know more.
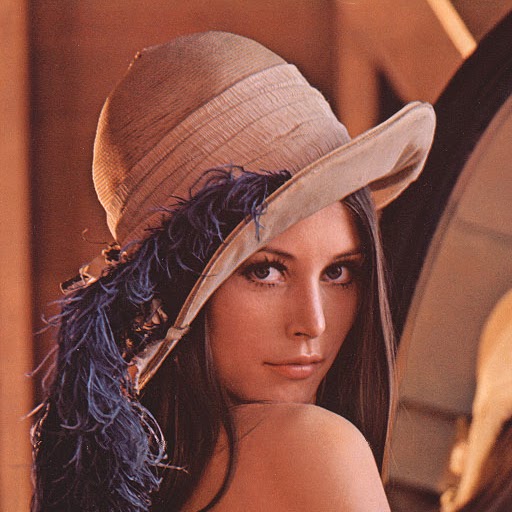
Take SVD image compression in the previous post as an example, we would like to know the relationship between the number of singular vectors, compression rate and image quality. We also want to examine the effectiveness of the algorithm when it comes to RGB images. In this example, we use the following image:
We can write the program as below:
from PIL import Image
import numpy as np
from scipy.linalg import svd
import matplotlib.pyplot as plt
from matplotlib.widgets import Slider, CheckButtons

img = Image.open('2019-05-17-sci-py-1.jpg')
npImg = np.asarray(img).astype(np.float32) / 255.0

# apply svd to each channel
svdMatrices = [svd(npImg[:, :, channel], compute_uv=True, full_matrices=True) for channel in range(3)]
# unpack the matrices
us, ss, vts = zip(*svdMatrices)

# the function that reconstructs the image given k
def Reconstruct(k, channels=[True, True, True]):
    newImg = np.zeros(npImg.shape, npImg.dtype)
    number = None
    for channel in range(3):
        newU = us[channel][:, :k]
        newS = ss[channel][:k]
        newVt = vts[channel][:k, :]
        if channels[channel]:
            recon = np.dot(np.dot(newU, np.diag(newS)), newVt)
            recon = np.clip(recon, 0.0, 1.0)
            newImg[:, :, channel] = recon
        if number is None:
            number = newU.size + newS.size + newVt.size
    return newImg, number

fig = plt.gcf()
pltIm = plt.imshow(npImg)
# construct slider
axButton = plt.axes([0.01, 0.4, 0.15, 0.15])
axSlider = plt.axes([0.2, 0.02, 0.35, 0.03])
slider = Slider(axSlider, '$k$', 1, np.min(npImg.shape[:2]), valinit=20, valfmt='%d')
button = CheckButtons(axButton, ['R', 'G', 'B'], actives = [True, True, True])
textObj = fig.text(0.2, 0.9, 'Image')


def update(event):
    channels = button.get_status()
    k = int(slider.val)
    newImg, number = Reconstruct(k, channels)
    pltIm.set_data(newImg)
    textObj.set_text('original: {}, compressed: {}, compression rate: {:.2f}'.
                     format(npImg.size, number, float(number) / npImg.size))
    fig.canvas.draw()

# run update once
update(None)
# assign the update function
button.on_clicked(update)
slider.on_changed(update)

plt.show(fig)
The resulting application is shown as follows: